Carlos Lunetta, MFA ’05
project
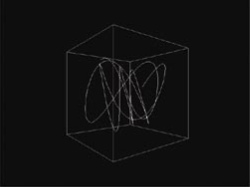
The Chordinator re-creates and expands Lissajous experiment as an interactive computer application. Lissajous projection was limited to one single interval; two notes, because his physical projection system could only be bi-dimensional. The starting point of the Chordinator is to take advantage that a computer system can create the illusion of depth easily. There are 3 spatial dimensions that the human perception can discern: height, width and depth. Musical chords are 3 (or more) notes played together; two intervals in the same period of time, in a chord structure (root, II degree, III degree, the button labels). The idea is to assign a spatial dimension to a sound frequency, and explore the plasticity of sound as a sculpture.
The sketch allows the independent control of the intensity of each chord component, as well as its phase. Phase can be understood as the coordination point between sound waves
To help the sense of 3 dimensional space, a cube was added marking the capping of the volume; rotation was added so the point of view can change over time, allowing a full visualization of sound in 3D.
Despite of the strong sound concept, the Chordinator experience aims to sculpt a visual structure over time: the keyboard is controlling a form in space, not music.
Production notes
The Chordinator employs a very simple programming concept: parametric equations, where independent equations drive different coordinate axis. The musical note visual component is a graph plotted through time; each coordinate is being fed by an algorithm that determines the amplitude, pitch and phase of sound, independently. There’s an independent module that creates the cube and another that controls the interface. The algorithm follows trigonometric principles, where the sound vibration can be expressed as a sine wave, with defined amplitude, length and period.
The 3D visualization was built in Processing, and the keyboard interface in Flash. they both work together in a browser window, allowing this visual experience to be shared online.
The Harmonographer
The harmonograph was an invention built and sold in the nineteen century and it consisted in pendulums attached to a pen; the pendulum movement set the pen coordinates, drawing the resultant of two (or three) harmonic motions. The final drawing is a frequency interval, like the Lissajous experiment; the pendulums also had the nice feature of simulate the damping of a musical note, the slow decay to silence, thanks to the mechanic energy that is dissipated within the motion. Another feature of the harmonograph was the use of rotary motion; it added a new dimension and perspective to the visualization. The frequencies were more dimensional, more representative of their physical nature in space han the Lissajous projection.
There was a strong relation between musical harmony and visual harmony in the interval drawings of the Harmonograph; perfect intervals were symmetrical and visually stable; numerical approximations in the frequencies produced more unbalanced visuals, with a more intricate nature.
The Harmonographer project is the translation of the physical device to the computer; it has the feature of dialing in the musical notes, obtaining the correct intervals. It also simulates the musical damping, and the phase oscillation.
The images produced by the Harmonographer should be understood as drawn from the outer edges (maximum volume) to the center (silence) – the path of decay. The constant rotation of the drawing has a purpose: show the interval at all possible sound coordination points, and its circular motion comes from the phase value. The phase is a cyclic event (it repeats according to the length of a wave), so there’s a constant rotation impression to the coordinates.
The sketch also features acceleration from one interval to another and variable interval change speed; the function of both is to induce a smooth transition between different visuals, letting the user know what is happening from one note to another — or just fi‚y through all possibilities.
A ”Portamento” button is available to turn on the infinite sliding between notes; in the portamento mode, the interval grows eternally, and the user can keep on watching and observing how the intervals grow and their visual elements change with the growth.
The main objective of the Harmonographer is let the user explore the interval relations through their visual representation; or simply explore the visual patterns and their mandala-like formations, tweaking the possible graphical formations that the algorithm can build.
A special version of the Harmonographer was also built, that allows the user to export the drawing as a vector file, that can be used in any graphic application or printed. The user can also save the drawings as bitmaps, and create video animations.
Production Notes
The coding behind the harmonographer is based on parametric equations, independent plot instructions for x and y values. The code is slightly more complicated than the Chordinator, since there are formulas for the damping – that use the harmonic damping formula from physics books. The damping was implemented as an algorithm, and the phase rotary motion was added as well — using again the trigonometric circle concept. The code has separate sets of acceleration and portamento functions, and all the interface commands function, along with the Flash virtual-keyboard element.
Keywords: chordinator, harmonographer, visualization


